

MARKET OVERVIEW
Nigerian agro-export complex — week of 14–18 September 2026
COCOA — ICE $5,860/t | −3.6% WoW | two-week low
- Gave back a further 3.6% as ICE-monitored stocks reached a two-year high of roughly 3.42m bags, easing concerns over near-term availability.
- Ivorian port arrivals hit 2.14 MMT through 13 September, 18% ahead of last year, and Barry Callebaut now describes the global market as well supplied.
- Nigerian farmgate follows ICE with a two-to-four week lag — forward-sold tonnage is the exposure.
CASHEW (RCN) — ~$1,350/t | 2026 season closing
- Holding near $1,350/t with the season in its final weeks; Nigerian nut still trades at a discount to Ivorian origin on outturn and moisture.
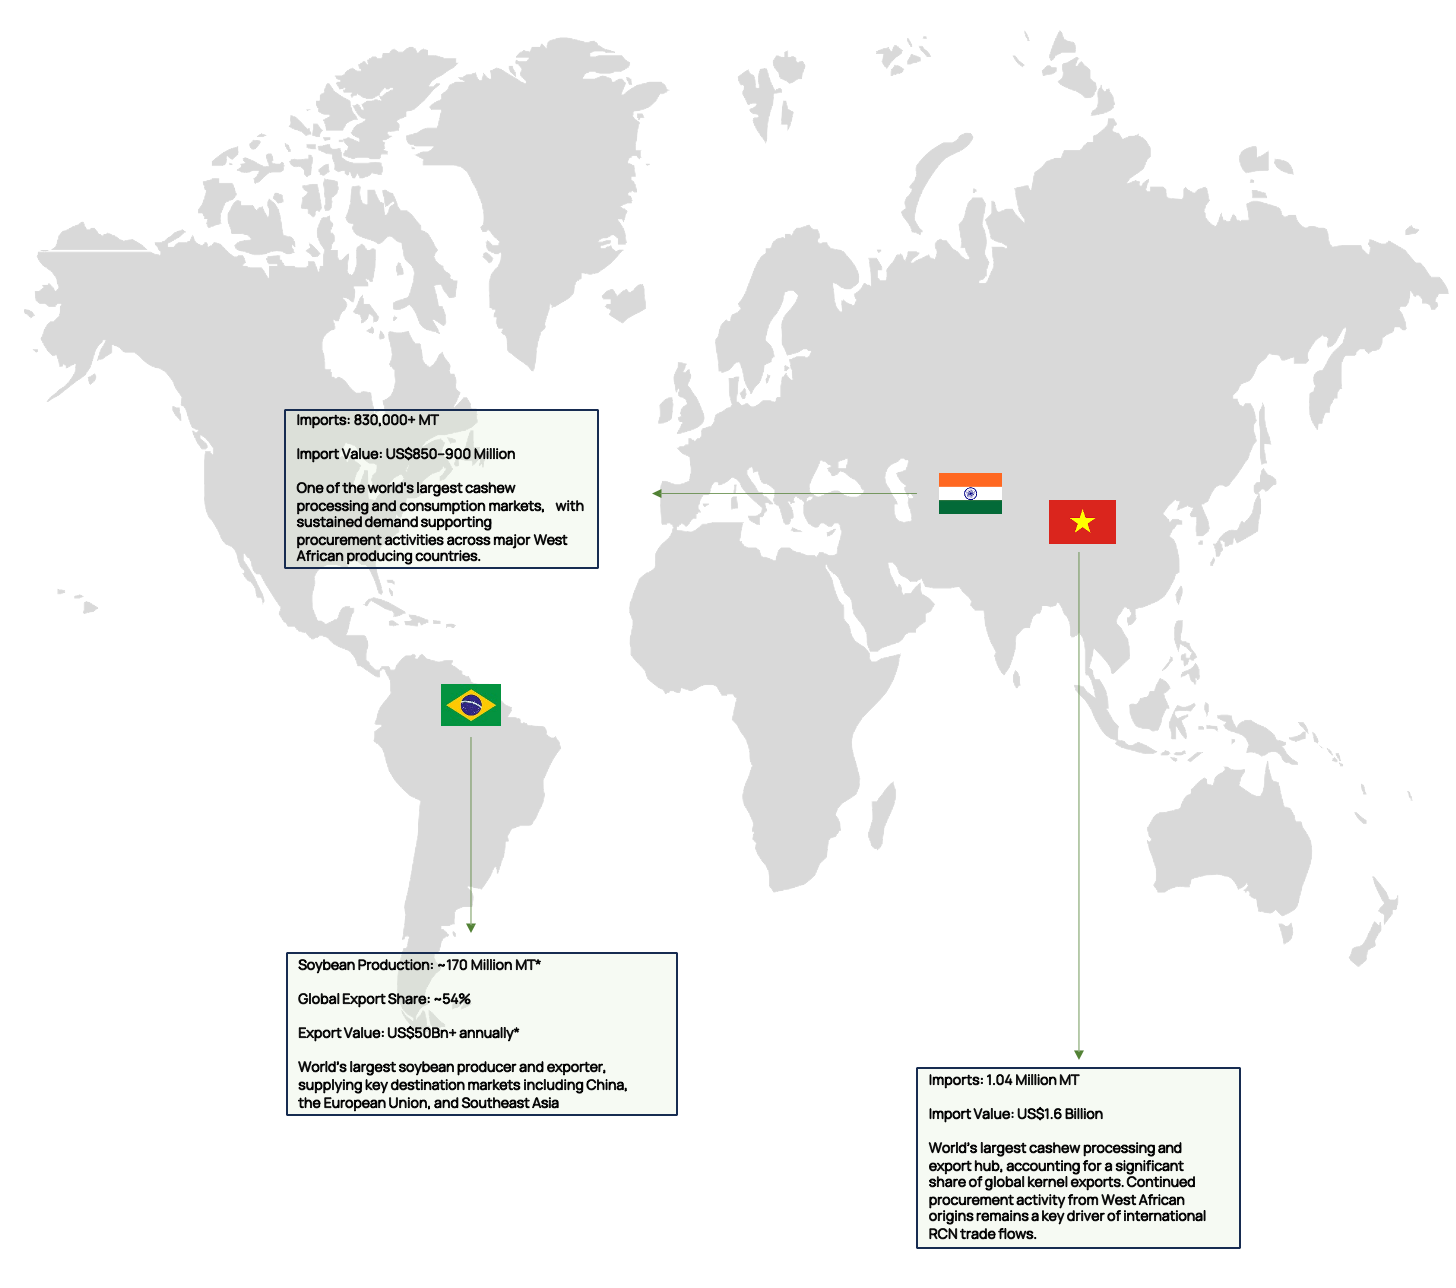
- India absorbs 830,000+ MT of imported RCN a year (US$850–900m), anchoring structural demand, while Vietnam sets the kernel price.
- Domestic processing capacity, not demand, caps value capture.
SESAME SEED — $1,700–2,030/t CNF | 98–99% purity
- Quoted at $1,700–2,030/t CNF against a 2024 average export price of $2,290/t — pricing has drifted lower and volatility remains the defining feature.
- China, Japan and India take around 60% of Nigerian export value; Cameroon and Turkey supply the offsetting import flow.
- Sortex capability and purity spec, not volume, determine realised price.
HIBISCUS — ~$1,600/t | scarce but thin
- Benchmark near $1,600/t. Nigeria and Sudan dominate exportable supply, so any Sudanese disruption transmits into price almost immediately.
- The buyer base is narrow — Mexico and EU herbal and beverage — and lot sizes are small; liquidity rather than scarcity caps the financeable ticket.
- Phytosanitary rejection is the recurring execution risk.
SOYBEAN — ~$410/t | offshore price formation
- A CBOT derivative: crush margin is a function of FX and freight rather than Nigerian fundamentals.
- A stronger naira compresses export receipts while cheapening imported inputs — broadly neutral for crushers, negative for pure exporters.
- Lowest liquidity-adjusted return in the basket.
MACRO READ-THROUGH
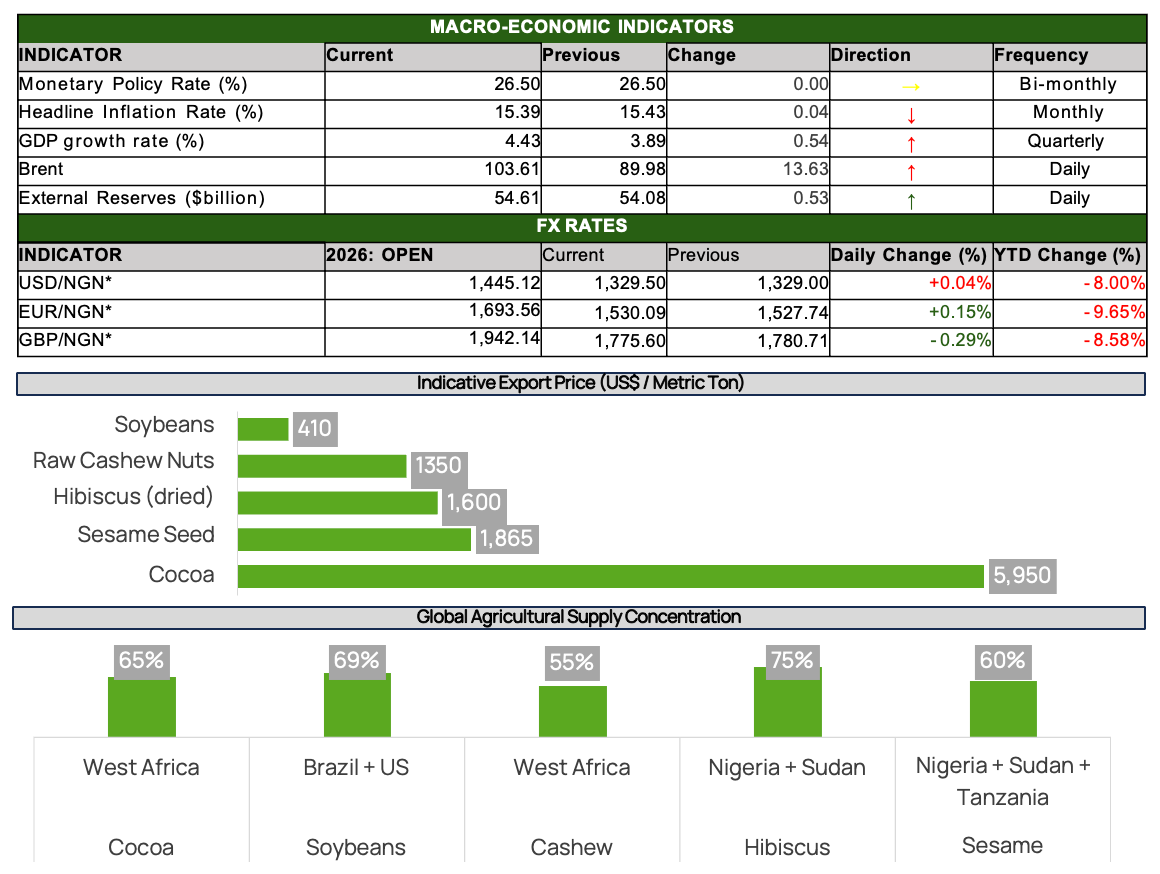
- Naira held near ₦1,329.50/$ for four straight sessions, 8.0% firmer YTD, with reserves at $54.61bn — an 18-year high that gives the CBN room to defend the level.
- Headline inflation eased again to 15.39% in August, a third consecutive month of disinflation, while food inflation moderated to 19.57% year on year.
- MPR stays at 26.50% into the 21–22 September MPC, so naira working capital remains expensive; Brent’s jump to ~$104 pushes freight and logistics costs higher.
Regional Supply Concentration Risk
- Cocoa — Côte d’Ivoire and Ghana account for 65% of world output; a weak Ivorian main crop feeds straight into price. Dec-26 fell a further 3.6% this week to $5,860, a two-week low, as ICE-monitored stocks hit a two-year high.
- Soybean — Brazil and the US alone set 69% of traded supply. Nigeria has no influence on the curve and imports the entire margin outcome — at $13.21/bu and near the highest since December 2023, that import is now expensive.
- Cashew — West Africa supplies 55% of global RCN, but India and Vietnam control processing. Origin risk is low; offtake concentration is the real exposure.
- Hibiscus — Nigeria and Sudan hold 75% of tradeable supply against a narrow beverage and herbal buyer base — the highest two-sided concentration in the basket.
- Sesame — Roughly 60% of exportable supply sits with Nigeria, Sudan and Tanzania, while China, Japan and India take about 60% of Nigerian export value.
Position sizing, not origin diversification, is the control.
SPOTLIGHT — SESAME SEED
Physical FOB Nigeria · no listed hedge · demand-led pricing · week of 14–18 September 2026
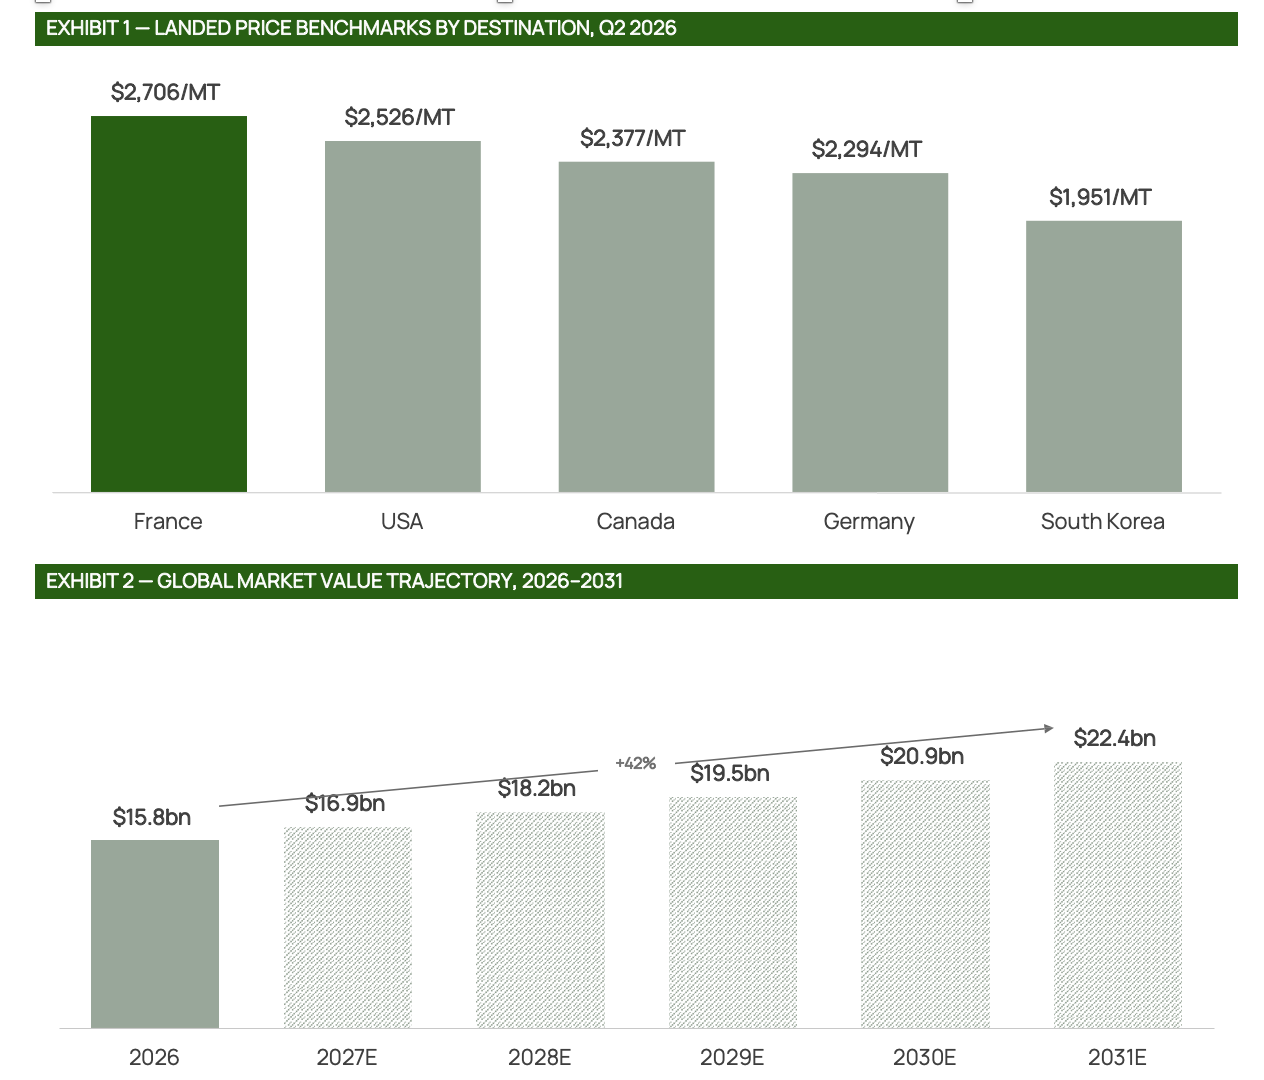
EXHIBIT 3 — WHAT IS DRIVING SESAME
- Price level — Landed benchmarks cleared $2,294–$2,706/MT across Europe and North America in Q2 2026, against a $1,772/t world export average in 2024. Nigerian FOB stays demand-led with no listed contract to hedge.
- Demand — Asia-Pacific held 46% of global volume in 2025 and China remains the anchor import market. Japanese export unit prices ran +142% year on year and Pakistan +34.6%, while South Korea fell 23.6%.
- Supply — India, Sudan, Myanmar and Tanzania account for over half of a ~7 MMT global crop. Africa supplies most of the raw seed but captures limited downstream value.
- Growth — Market value of $15.8bn in 2026 compounds at 7.23% to $22.4bn by 2031, with Africa the fastest region at a 9.8% CAGR.
EXHIBIT 4 — POSITIONING AND RISK
- Bias — Firm. Asia demand-led. With no listed hedge, the live exposure is offtake concentration rather than price discovery.
- Concentration — Roughly 60% of exportable supply sits with Nigeria, Sudan and Tanzania, while China, Japan and India take about 60% of Nigerian export value — two-sided and unhedgeable.
- Quality gate — EU and Japanese aflatoxin limits are the binding commercial risk. Pre-shipment testing is now a cost of market access, not an option.
- Logistics — Red Sea routing keeps freight costs volatile on Asia-bound flow.
- Watch — The Ethiopian Commodity Exchange sesame contract remains thin. Until liquidity builds, the basket has no price-discovery venue.
KEY TAKEAWAY
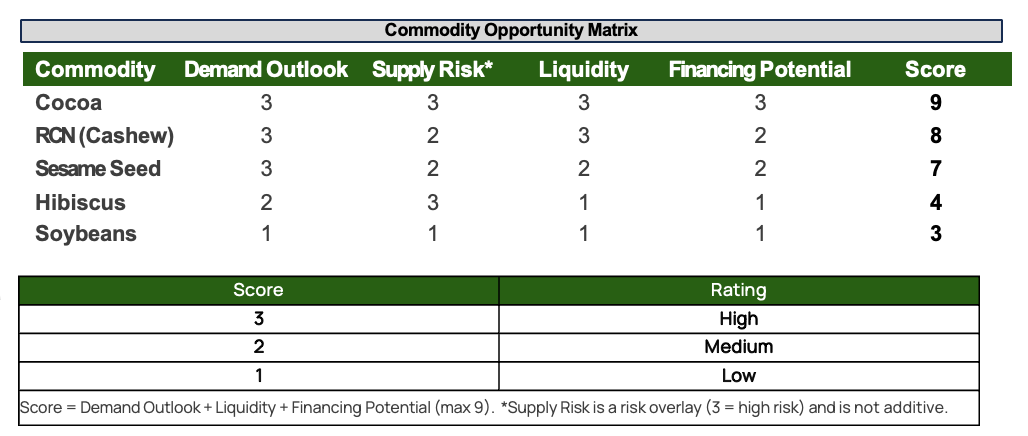
- Additionality — cocoa and RCN clear commercial hurdles unaided. Financing value sits one layer down, in the aggregators and mid-cap processors banks will not underwrite.
- Priority — cocoa scores 9 of 9 on demand, liquidity, and financing. RCN follows at 8, held back by processing capacity; Côte d’Ivoire’s 1.3 MMT grind target is the read-across.
- Impact density — sesame scores 7 and reaches the most smallholders per dollar deployed, but liquidity is the binding constraint; it suits blended or first-loss structures.
- Compliance gate — EUDR plot-level traceability is now a condition precedent for EU-bound cocoa. Portfolios without it forfeit the premium market.
- Exclusion — hibiscus at 4 and soybeans at 3 fail the liquidity and financing tests; soybean pricing is set offshore, leaving no defensible local margin.
BOTTOM LINE
- Deploy — anchor the facility in cocoa (9) and RCN (8): senior secured, self-liquidating, advance rates struck off $5,500, not $6,078 spot.
- Structure — use concessional first-loss to open the sesame (7) and hibiscus (4) tranches the commercial market will not price.
- Currency — draw in naira at ₦1,347/$ while the disinflation path holds; leave price risk with the offtaker.
- Impact floor — covenant 60% smallholder-sourced volume and plot-level traceability, not aspirational targets.
- Monitor — food inflation at 20.31%, Brent near $90, and a 25kt cocoa surplus turn a performing book stressed.
- Decline — no incremental soybean (3) exposure at $13.00/bu, +29.2% y/y.
WEEK IN REVIEW — PRICE, POSITIONING & BASIS
Week of 14–18 September 2026 · EquiNorth Capital Commodities Weekly · West Africa agri complex
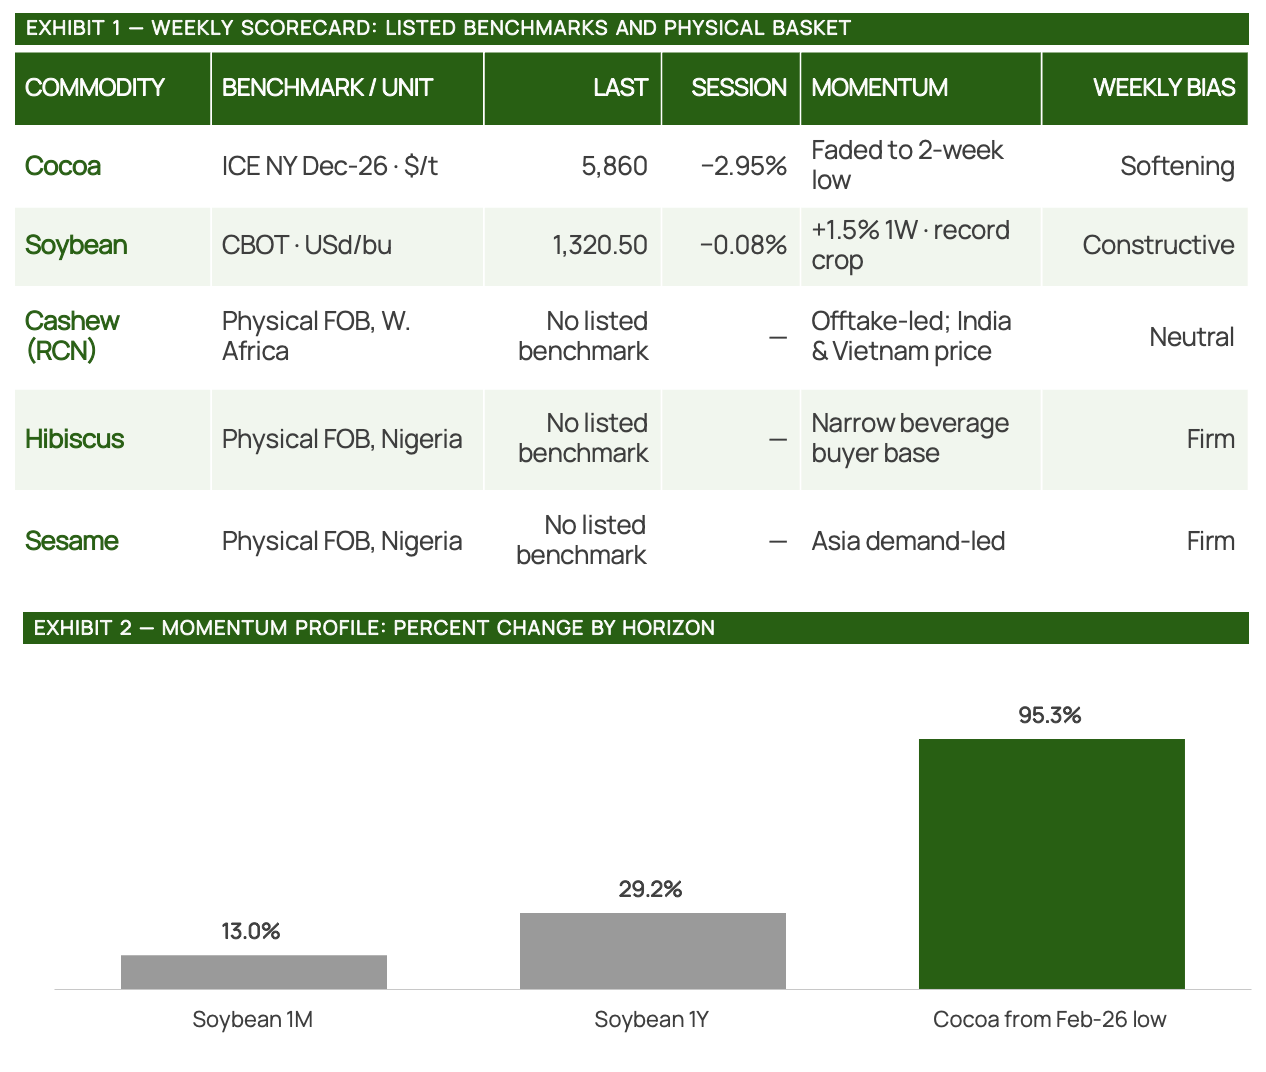
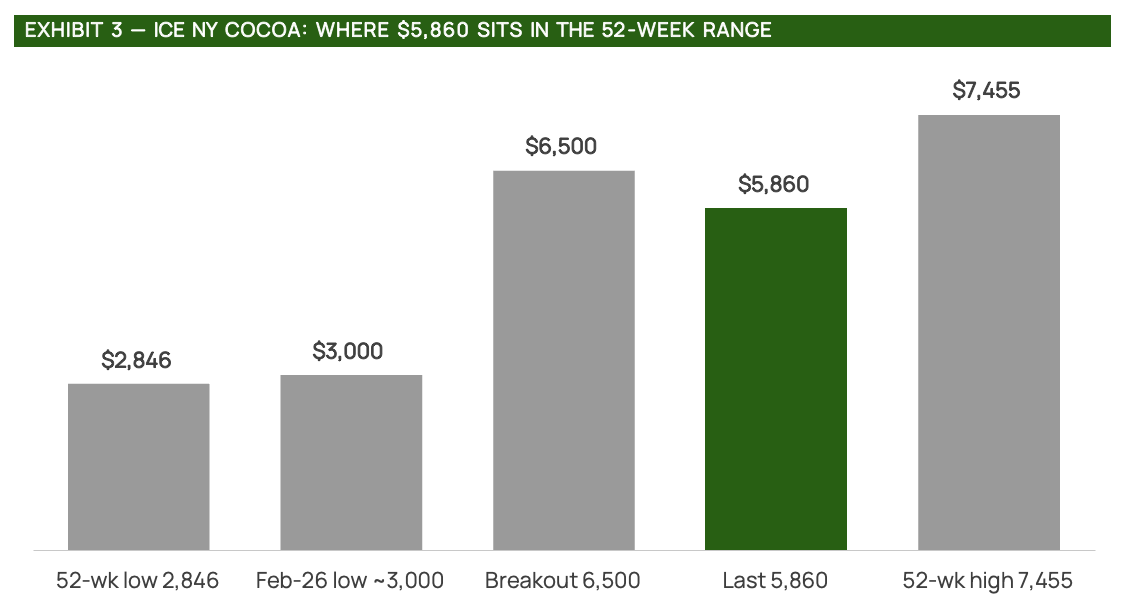
EXHIBIT 4 — WHAT MOVED THE WEEK
- Cocoa — 2026 extended its slide, losing a further 3.6% to $5,860, a two-week low, as ICE-monitored stocks reached a two-year high of about 3.42m bags and Ivorian arrivals ran 18% ahead of last year at 2.14 MMT through 13 September.
- Structural — Cote d’Ivoire targets 1.3 MMT of grinding capacity in 2026/27 against 650kt in 2025/26. Origin value capture rises; exportable bean supply falls.
- Soybean — Firm at $13.21/bu, near the highest since December 2023, after China booked roughly 1 MMT of US beans last week. The September WASDE lifted 2026/27 US output to a record 4.535bn bu, with ending stocks at 310m bu.
- Physical basket — Cashew, hibiscus and sesame carry no listed hedge. Weekly marks are offtake-driven, so the live exposure is buyer concentration rather than price discovery.
- Positioning — Cocoa risk has shifted to the downside while exchange stocks build; soybean momentum stays policy-dependent on the late-September US-China agricultural talks.
Source: ICE Futures US, CBOT, USDA, StoneX and exchange settlement data as at 18 September 2026. Physical FOB levels are indicative and non-tradeable. For institutional use only — not investment advice.